WBS Chart Pro
is now
WBS Schedule Pro
WBS Chart Pro vs. WBS Schedule Pro
WBS Chart Pro was our flagship product for over 20 years. In 2014, WBS Chart Pro was combined with our other former product, PERT Chart EXPERT, to produce the all new WBS Schedule Pro software. If you are looking for WBS Chart Pro, the features you have become accustomed to in WBS Chart Pro plus much more are now a part of WBS Schedule Pro!
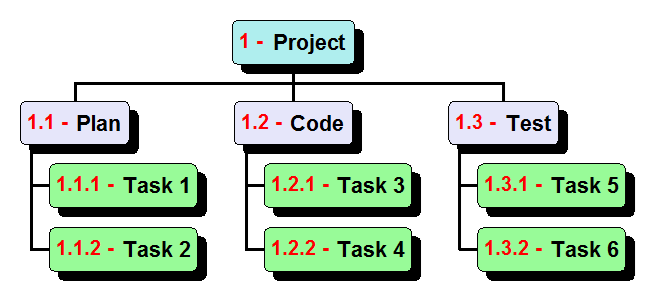
If you are looking for the best all-around software for creating WBS Charts, Project Breakdowns, or Hierarchical Mind Mapping diagrams, this is it.
Not only that, WBS Schedule Pro combines WBS Charts, Network Charts, Gantt Charts, Task Sheets plus numerous features to produce a feature-rich yet easy-to-use Project Management tool fully capable of planning and managing any project.
For a full description, see WBS Schedule Pro or click the link below to try WBS Schedule Pro yourself. You won't be disappointed.

Two versions to meet your needs
WBS Schedule Pro - This software contains all of the features of WBS Chart Pro combined with Network Charts and Gantt Charts to form a more complete project planning tool. See WBS Schedule Pro for details.
WBS Schedule Pro (WBS Version) - To meet the needs of users who only need WBS Charts, we have created the WBS Schedule Pro (WBS Version) software. This special version contains everything in WBS Schedule Pro except for Network Charts and Gantt Charts. See WBS Schedule Pro (WBS Version) for details.
Upgrading from WBS Chart Pro to WBS Schedule Pro
Current WBS Chart Pro users can upgrade to WBS Schedule Pro or WBS Schedule Pro (WBS Version). Special upgrade pricing is available for existing WBS Chart Pro users. See the Price and Ordering Information page for details. Or, go directly to the Critical Tools Store to order your upgrade today!
WBS Chart Pro Availability
WBS Chart Pro has reached its product end-of-life and is no longer available. We highly recommend upgrading to WBS Schedule Pro or to WBS Schedule Pro (WBS Version) as these are superior products with many new and exciting features.
Want to see more?
Go to the WBS Schedule Pro page to see all of the great features of this new software including the new Task Sheet, Free Form Text Boxes, Support for the Notes field, Seamless Microsoft Project Integration, Importing and Exporting to Excel, exporting to a WBS Dictionary and much more!