Network Charts
Plan, Manage & Display Projects using a Network Chart

Schedule your projects with a Network Chart
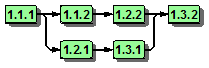
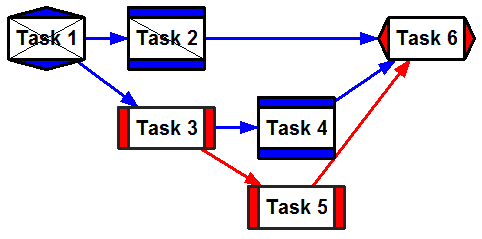
WBS Schedule Pro contains a Network Chart feature for planning and managing projects using a Network Chart (Dependency Diagram). Network Charts display the dependencies that exist between Tasks in a project. The order in which tasks occur is an important part of project planning and the Network Chart in WBS Schedule Pro simplifies the process of creating and displaying dependencies in an easy to follow diagram.
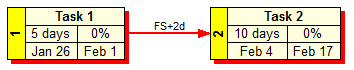
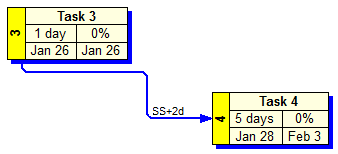
As a planning and scheduling tool, define the schedule in a project by clicking and dragging in the Network Chart to create tasks and dependencies between tasks. Doubleclick a task to add schedule information like Duration, Start, Finish, Cost, Work, etc. The Network Charts clearly display the dependency links in your plan so you can easily follow them. Your Network Charts can be managed separately or transferred to Microsoft Project or numerous other Project Management software applications.
As a display tool, Network Charts can be created from your existing Microsoft Project plans or from other Project Management Software. The Network Charts produced by WBS Schedule Pro are easier to follow and understand. Tasks in the Network are optimized on each page to minimize overlapping lines, reduce clutter and print on fewer pages.
See the Critical Path
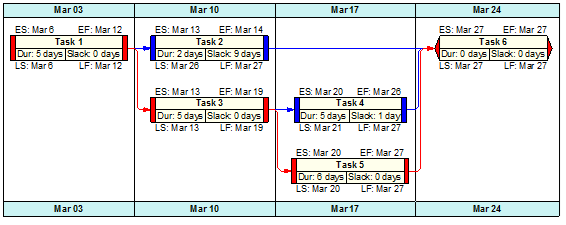
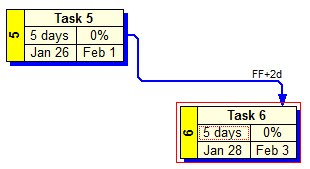
WBS Schedule Pro's scheduling engine automatically calculates Critical and Non-Critical tasks as you work. With the Network Chart you can quickly see the Critical Path and which tasks have a direct impact on the project's completion.

Customize
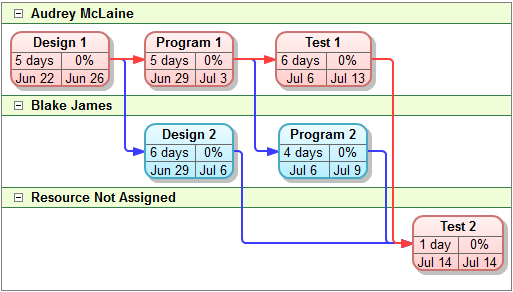
The Network Charts in WBS Schedule Pro are highly customizable. Group Tasks in horizontal bands across the page. Display a Timescale across the top of your Network Chart. Both features add an extra layer of clarity when displaying Tasks in a Network Chart!
Color boxes and link lines in the chart based on whether a task is Critical or Non-Critical, by the Progress (% Complete) of a task or create your own custom coloring criteria. Change box shapes, shadows and various attributes to make your Network Charts stand out.
![]()
![]()
![]()
![]()
![]()
Full of Features
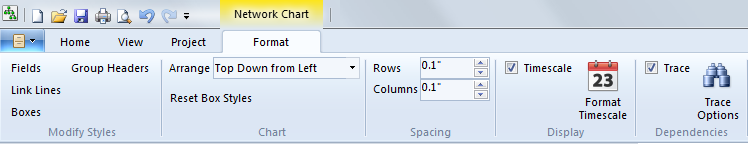
Loaded with features to make it easy to create and manage the dependencies in any project. Add a Timescale to the Network Chart, Trace dependencies, Show or Hide Groups (the horizontal separators or "swim lanes") and more!
We encourage you to explore these features of Network Charts by clicking the links in the upper right corner of this page or Download the software and try it yourself!