Gantt Charts
Plan, Manage & Display Projects using a Gantt Chart
Presentation-Quality Gantt Charts
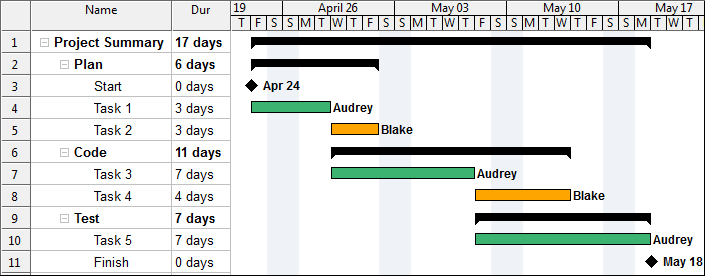
WBS Schedule Pro contains a Gantt Chart feature for planning, managing and displaying projects using a wide variety of Gantt and Bar Chart options. The Gantt Chart in WBS Schedule Pro has everything you need to easily create and present even the most complex of projects.
The left side of the Gantt Chart allows you to add Tasks, Indent to create Summary Tasks, click and drag to rearrange Tasks and add any Column you need to manage your project's data.
The Gantt Bar side of the chart allows you to click and drag to create dependencies between Tasks, drag to modify a Task's Duration and even click and drag to set % Complete.
Critical Path Scheduling - WBS Schedule Pro's scheduling engine automatically calculates Critical and Non-Critical tasks as you work. With the Gantt Chart, like the Network Chart in WBS Schedule Pro, you can quickly see the Critical Path and which tasks have a direct impact on the project's completion.
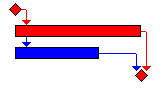
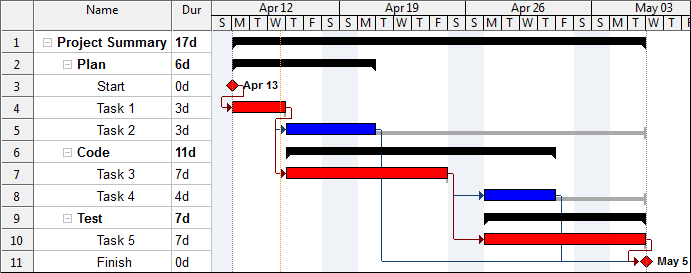
Multiple Gantt Bars
With the ability to add multiple Gantt Bars to a chart you can visually compare two sets of data. For example, you may want to compare Baseline Dates to the Current Schedule. Like this:
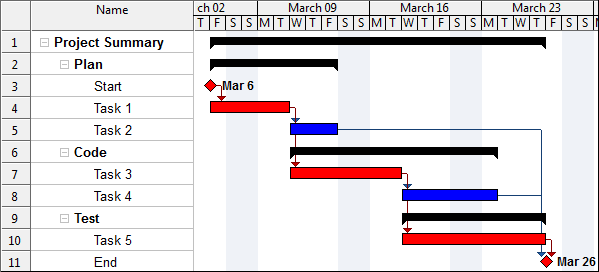
Or, show the Slack or Late Schedule of your Tasks. Like this:
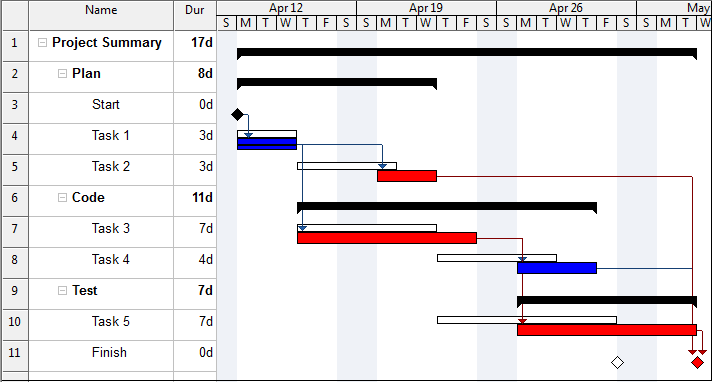
Customize
The Gantt Charts in WBS Schedule Pro are highly customizable. Color bars, add text to Tasks, Milestones and/or Summary Tasks. You can even remove links to show a pure Bar Chart of tasks.